Announcing Monitoring and Organizations
Announcing enhanced monitoring and organizations on Neon.
Neon’s serverless Postgres improves developer velocity and allows organizations to ship faster.
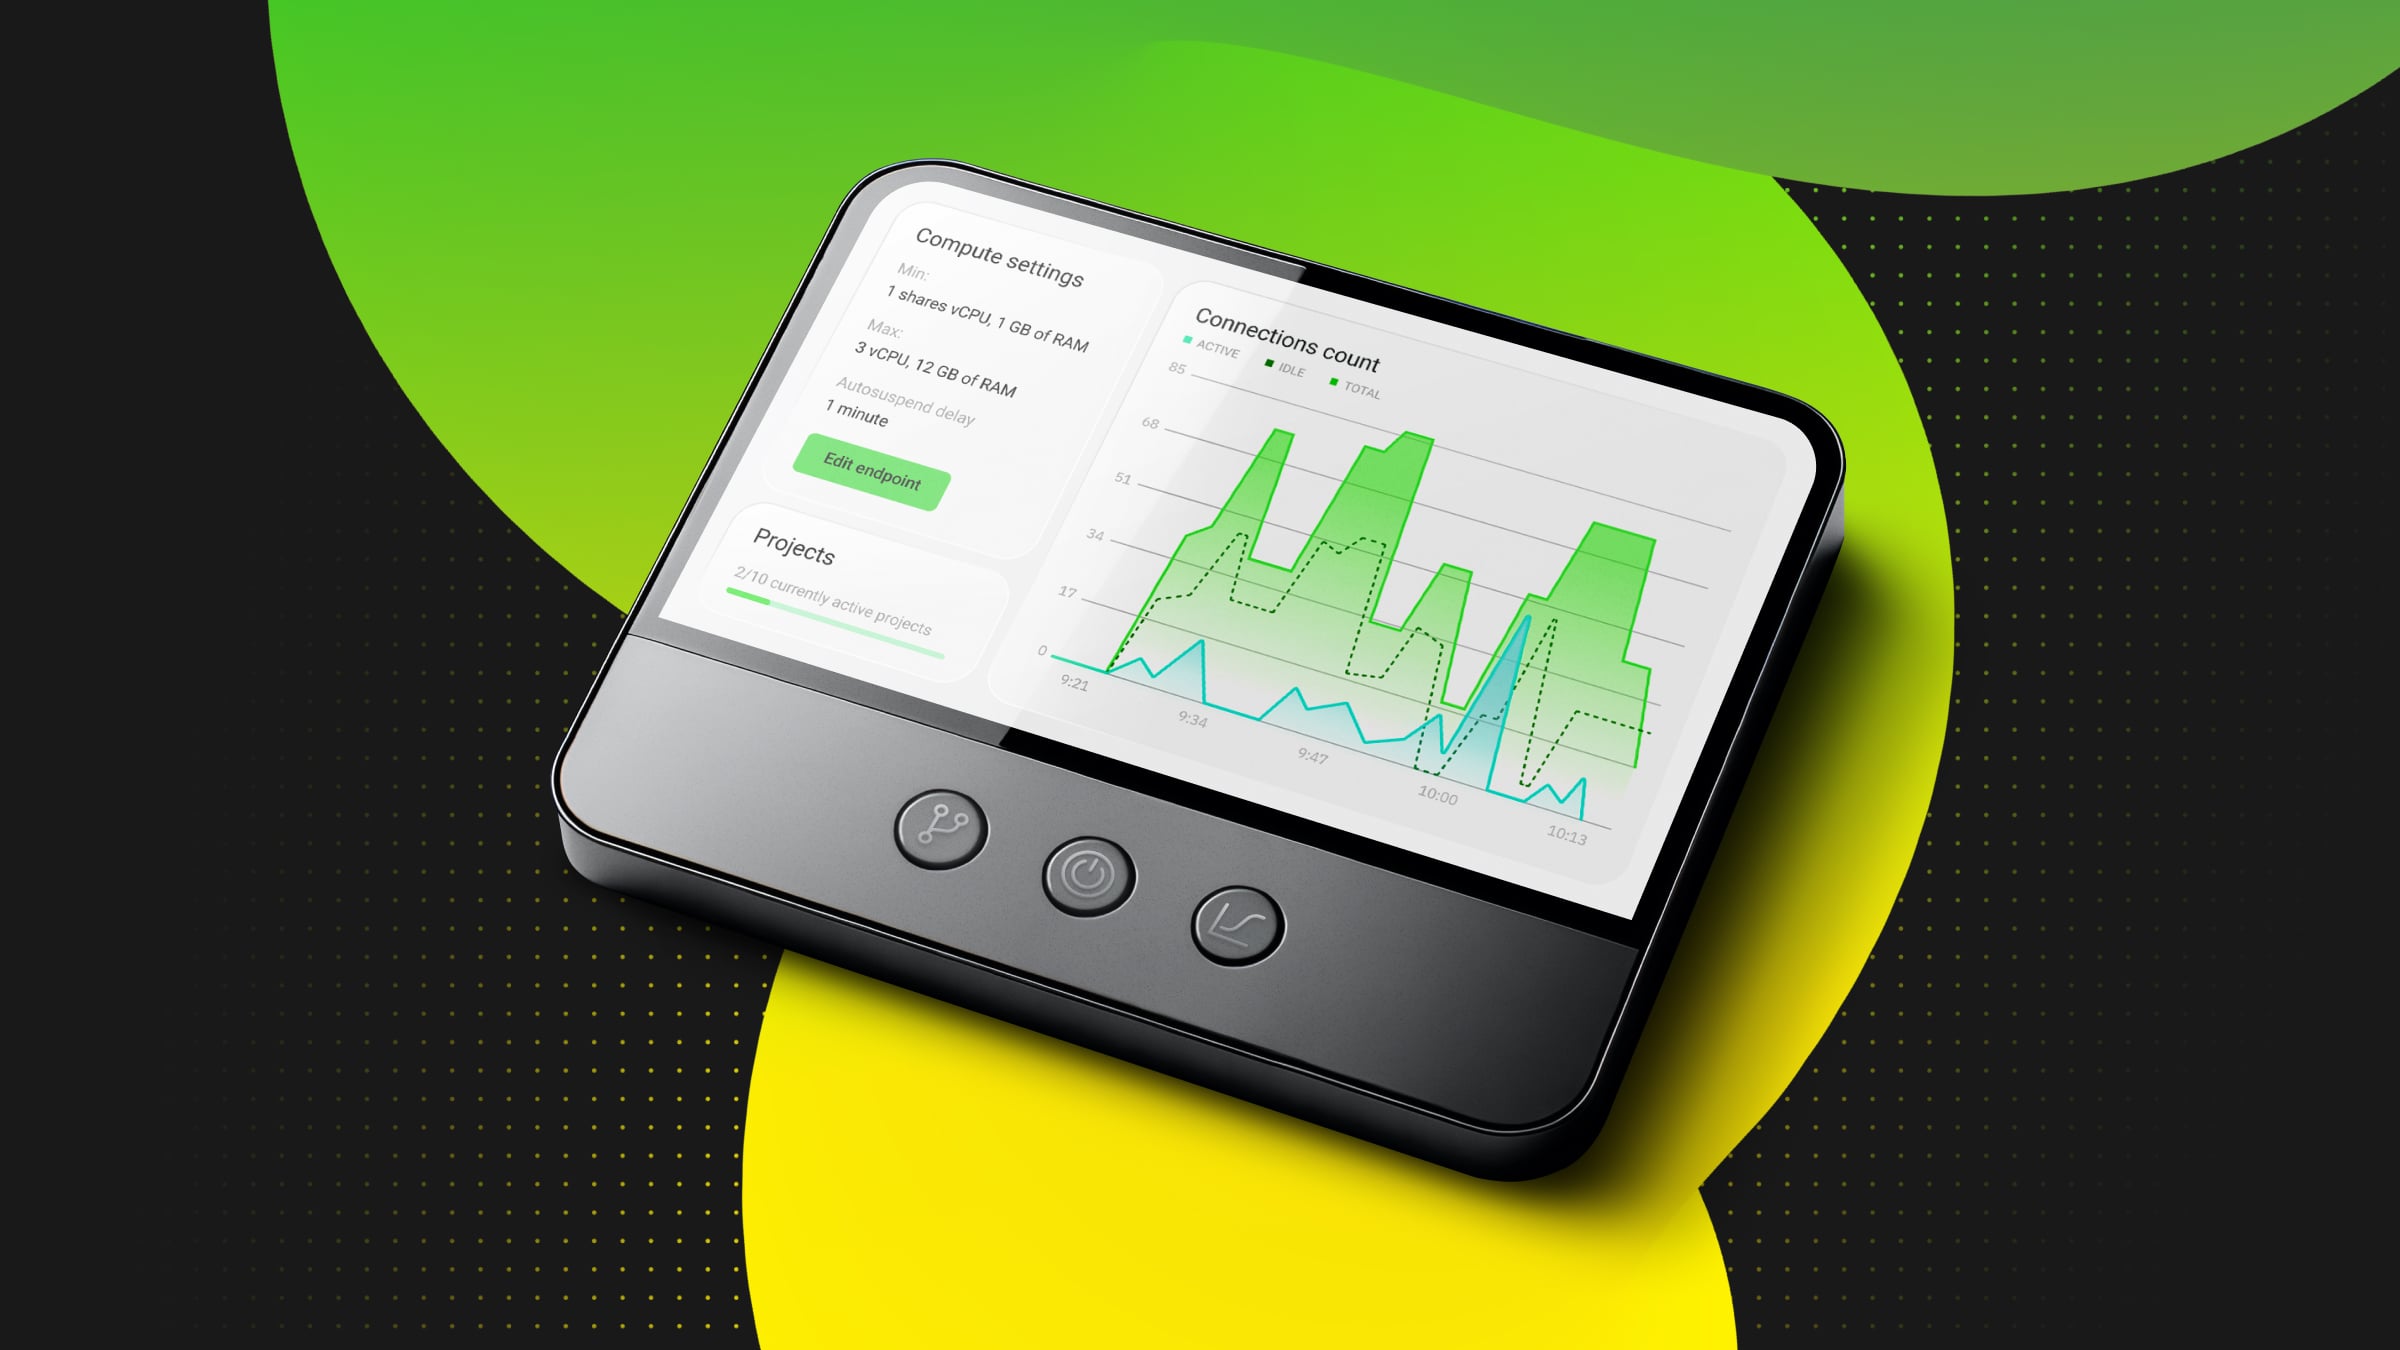
When using a database for your app, monitoring its performance is crucial. You can do that using Postgres extensions such as pg_stat_statements. However, if you’d rather do it from the UI, we’re happy to announce the release of the monitoring page on the Neon console.
We also understand that modern application development requires collaboration and teamwork, so we added Organizations to the Console, which is currently in Private Preview. Customers on the Launch and Scale plans can request access by contacting customer-success@neon.tech.
Let’s take a quick tour of these new features.
Monitoring
Using Neon means using Postgres. When you interact with Neon, you aren’t doing so using a wrapper – you’re interacting directly with a Postgres database.
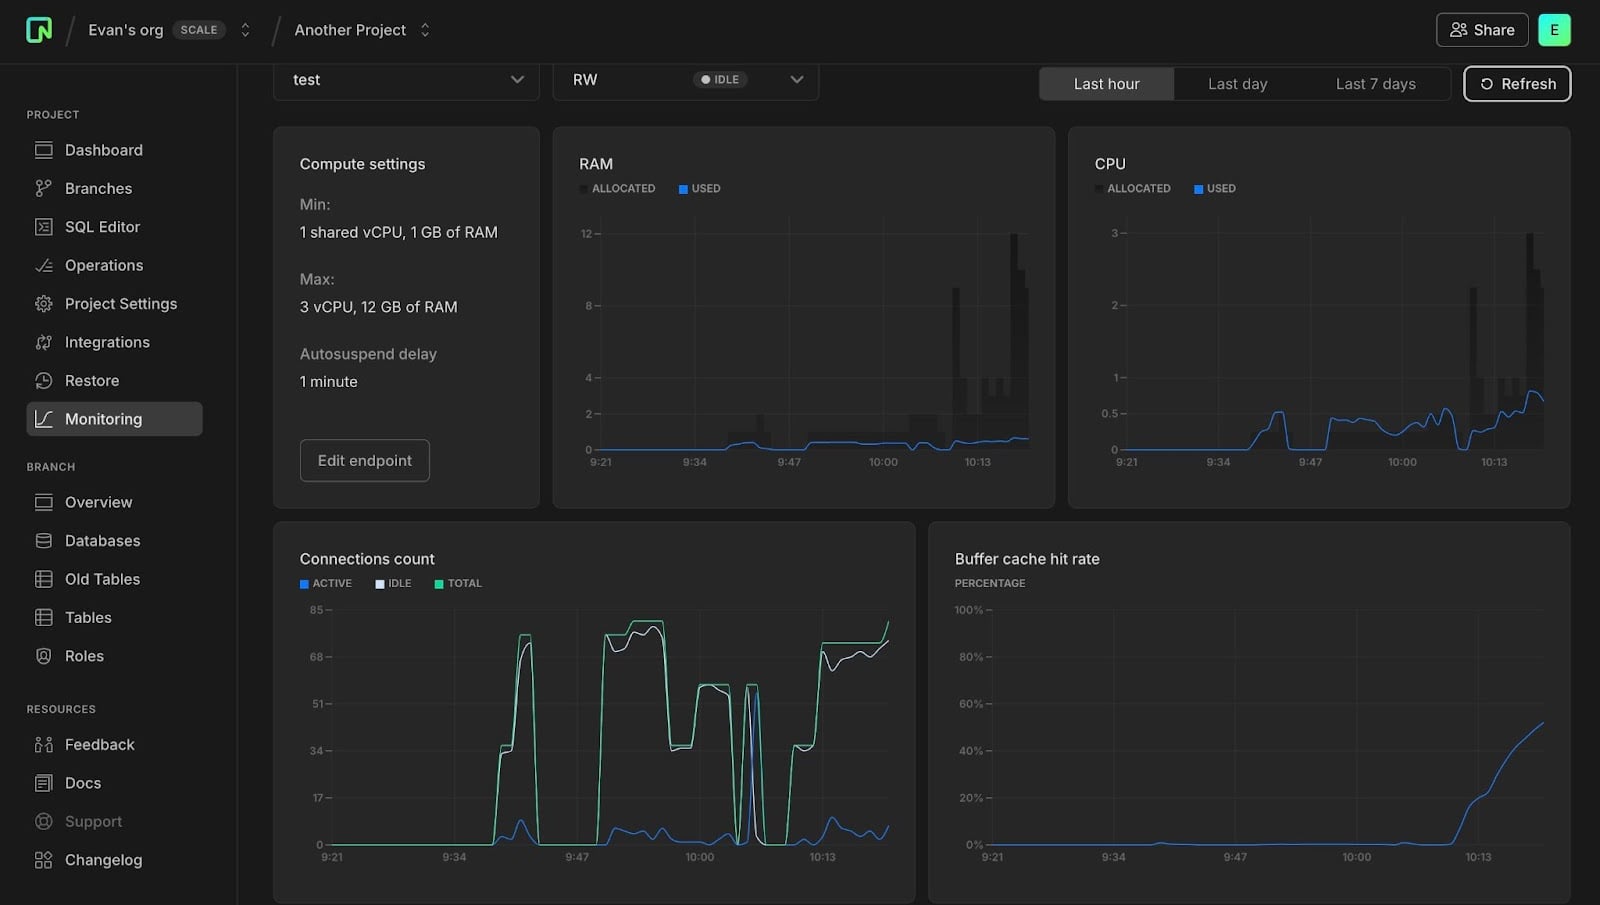
This provides you with a great deal of power and flexibility. It also means you can exhaust connections, cause deadlocks, and max out your allocated CPU and RAM. That’s why we’ve shipped a comprehensive monitoring dashboard in the Neon console.
The usual suspects, CPU and RAM, are present, but it also includes:
- Connections count
- Buffer cache hit rate
- Database size
- Deadlocks
- Rows
Understanding your application’s baseline performance and general performance trends is essential. Database branching alongside this knowledge enables teams to ship with greater confidence since they can use branches to test and compare their changes against their baseline. As the saying goes, “Measure twice, cut once”.
Take Monitoring for a Spin with pgbench
Take a test scenario created using pgbench as an example. First, prepare a database using pgbench.
pgbench -i -s 100 $DATABASE_URLThis results in a database that’s approximately 1.5 GiB in size, assuming it was empty prior. You can confirm the size using the new metrics dashboard database size field.
Now you can test the performance of this database and generate metrics using the following pgbench command. Try various values for the number of concurrent clients (-c) and see how the progress report changes every 30 seconds.
pgbench -c 95 -j 4 -P 30 -t 10000 $PG_URLUsing the default 0.25 CU compute size results in a lower number of transactions per second (TPS) versus 3 CU. You can see this clearly in the screenshot below. The cache hit rate increases dramatically after autoscaling is enabled and up to 12 GB of RAM becomes available to Postgres.
Monitoring can help you identify potential performance issues, but the metrics can also help you understand your storage usage. The Rows metric tracks the inserts, updates, and deletes you’ve made. More changes mean a larger history, which means increased storage usage if you have a large history retention window configured.
Organizations
Each project in Neon provides an isolated database timeline, the ability to create read-write endpoints and read-replicas, and branches for development and testing. Projects can be shared with other Neon users to facilitate collaboration.
Today, we’re announcing our Organizations feature in Private Preview. An organization represents a collection of projects, and members of the organization have access to those projects.
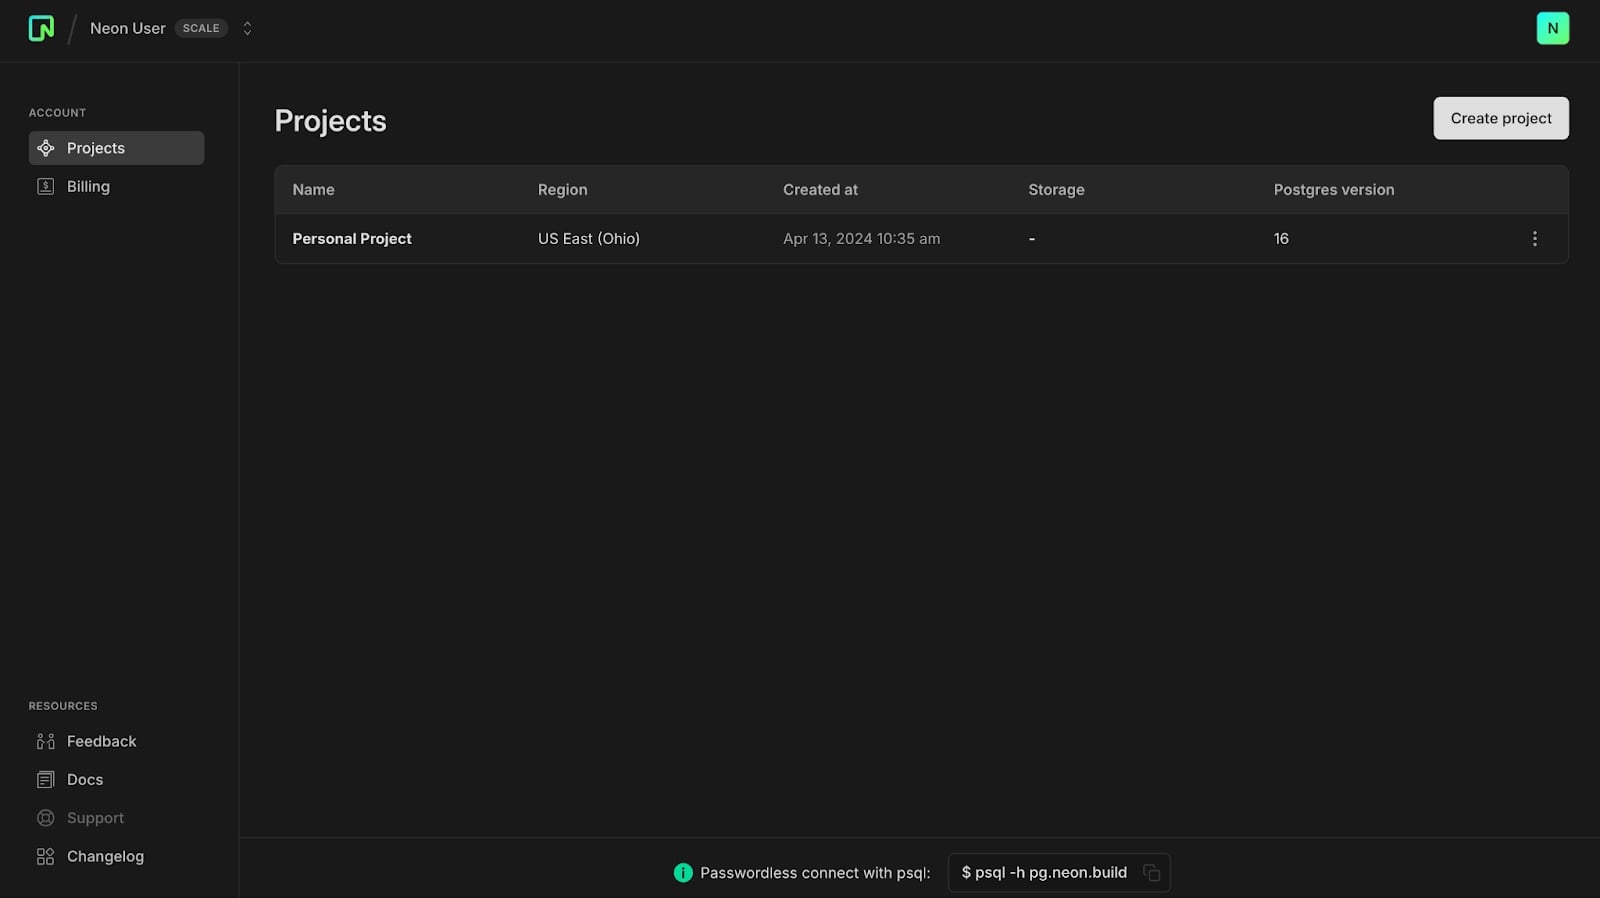
Take the following screenshot, for example. It looks like a regular Neon account that contains a single project, right?
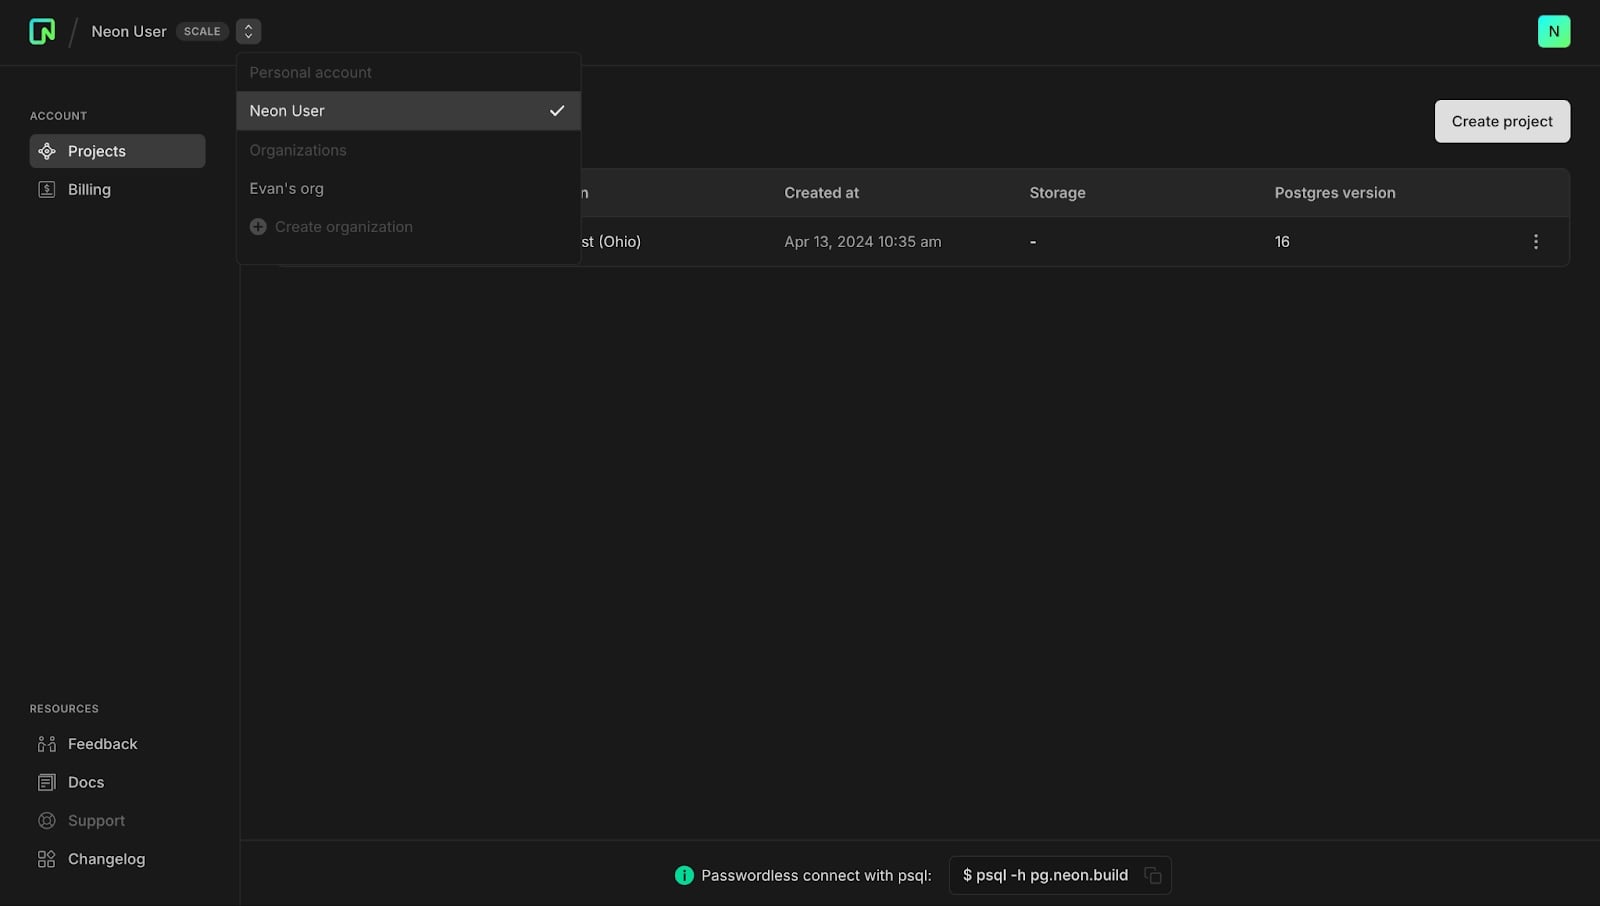
Clicking the dropdown in the navigation bar reveals that this user is part of an organization, Evan’s org.
Selecting the organization reveals that the user can access the two projects within the organization.
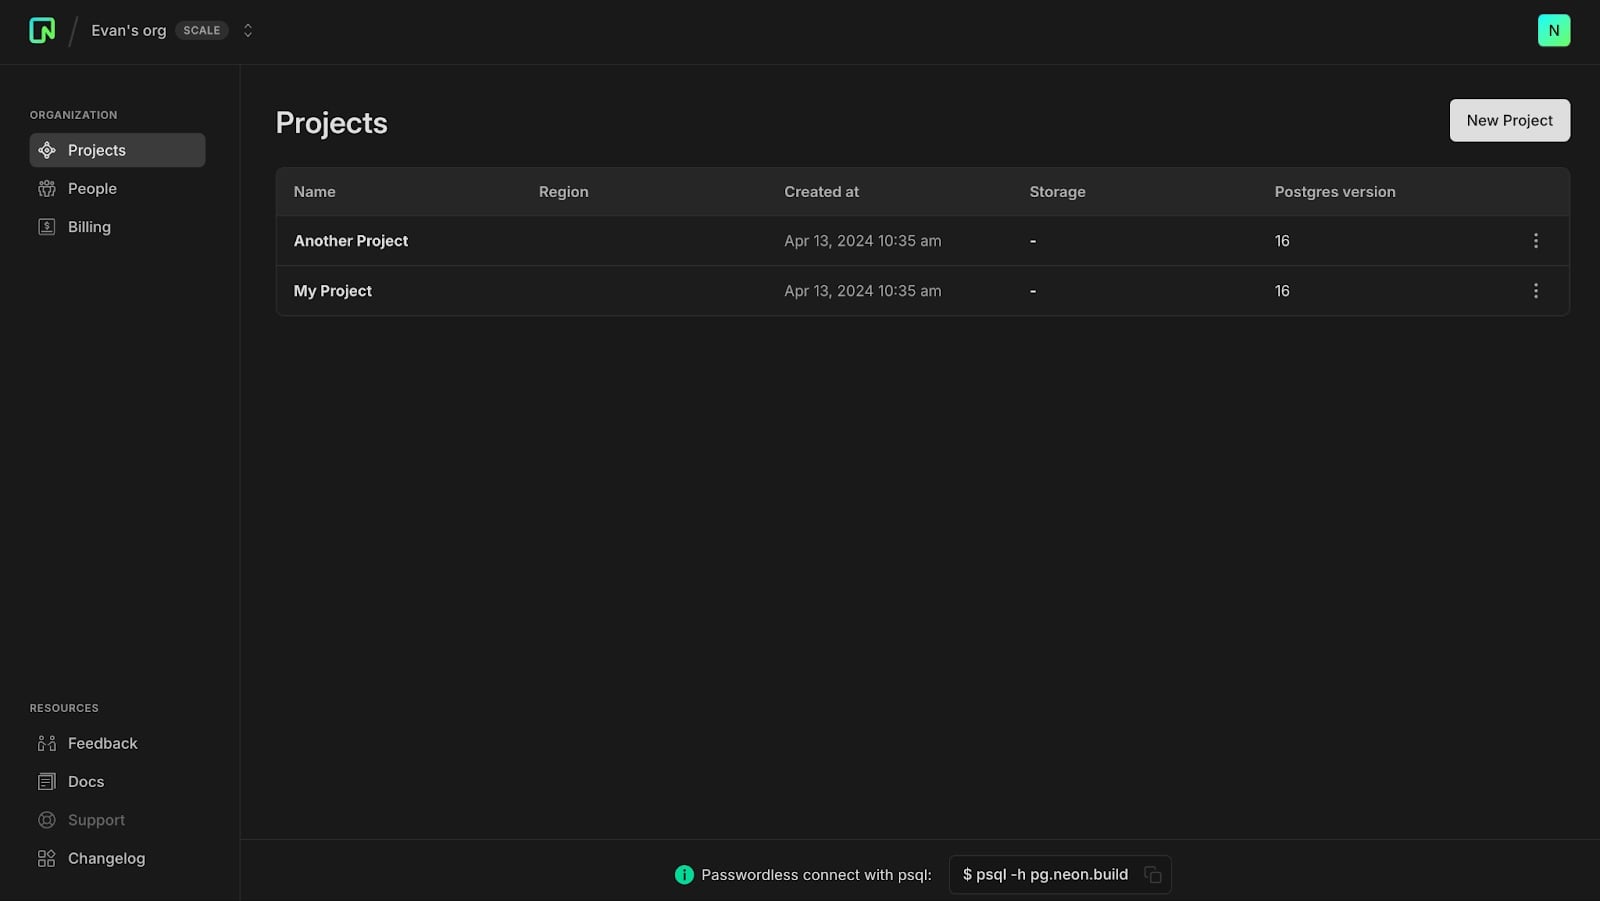
Projects within an organization can be shared just like personal projects, so you can invite individuals to a project, even if it’s within an organization. If you’re keen to try out organizations, then you should get in touch with customer-success@neon.tech.
Conclusion
Monitoring will provide you with better insights into your Neon usage and help you better understand your application’s traffic and load patterns.
Our new organizations feature is the next step for us in supporting our customers who are managing a fleet of Postgres databases and teams on Neon.
Remember, contact our customer success team if you’d like early access to organizations! Join us in Discord, follow us on X, and let us know what observability tools you’d like us to integrate with so you can scale your applications to millions of users.
